01
Wi-Fi site survey
Map discovered access points by channel and signal strength, with identity and security details available in the table.
WifiSurveyor places Wi-Fi network discovery, RF spectrum activity, and active channel-performance measurements on the same channel axis so congestion, interference, and real delivery can be interpreted together.
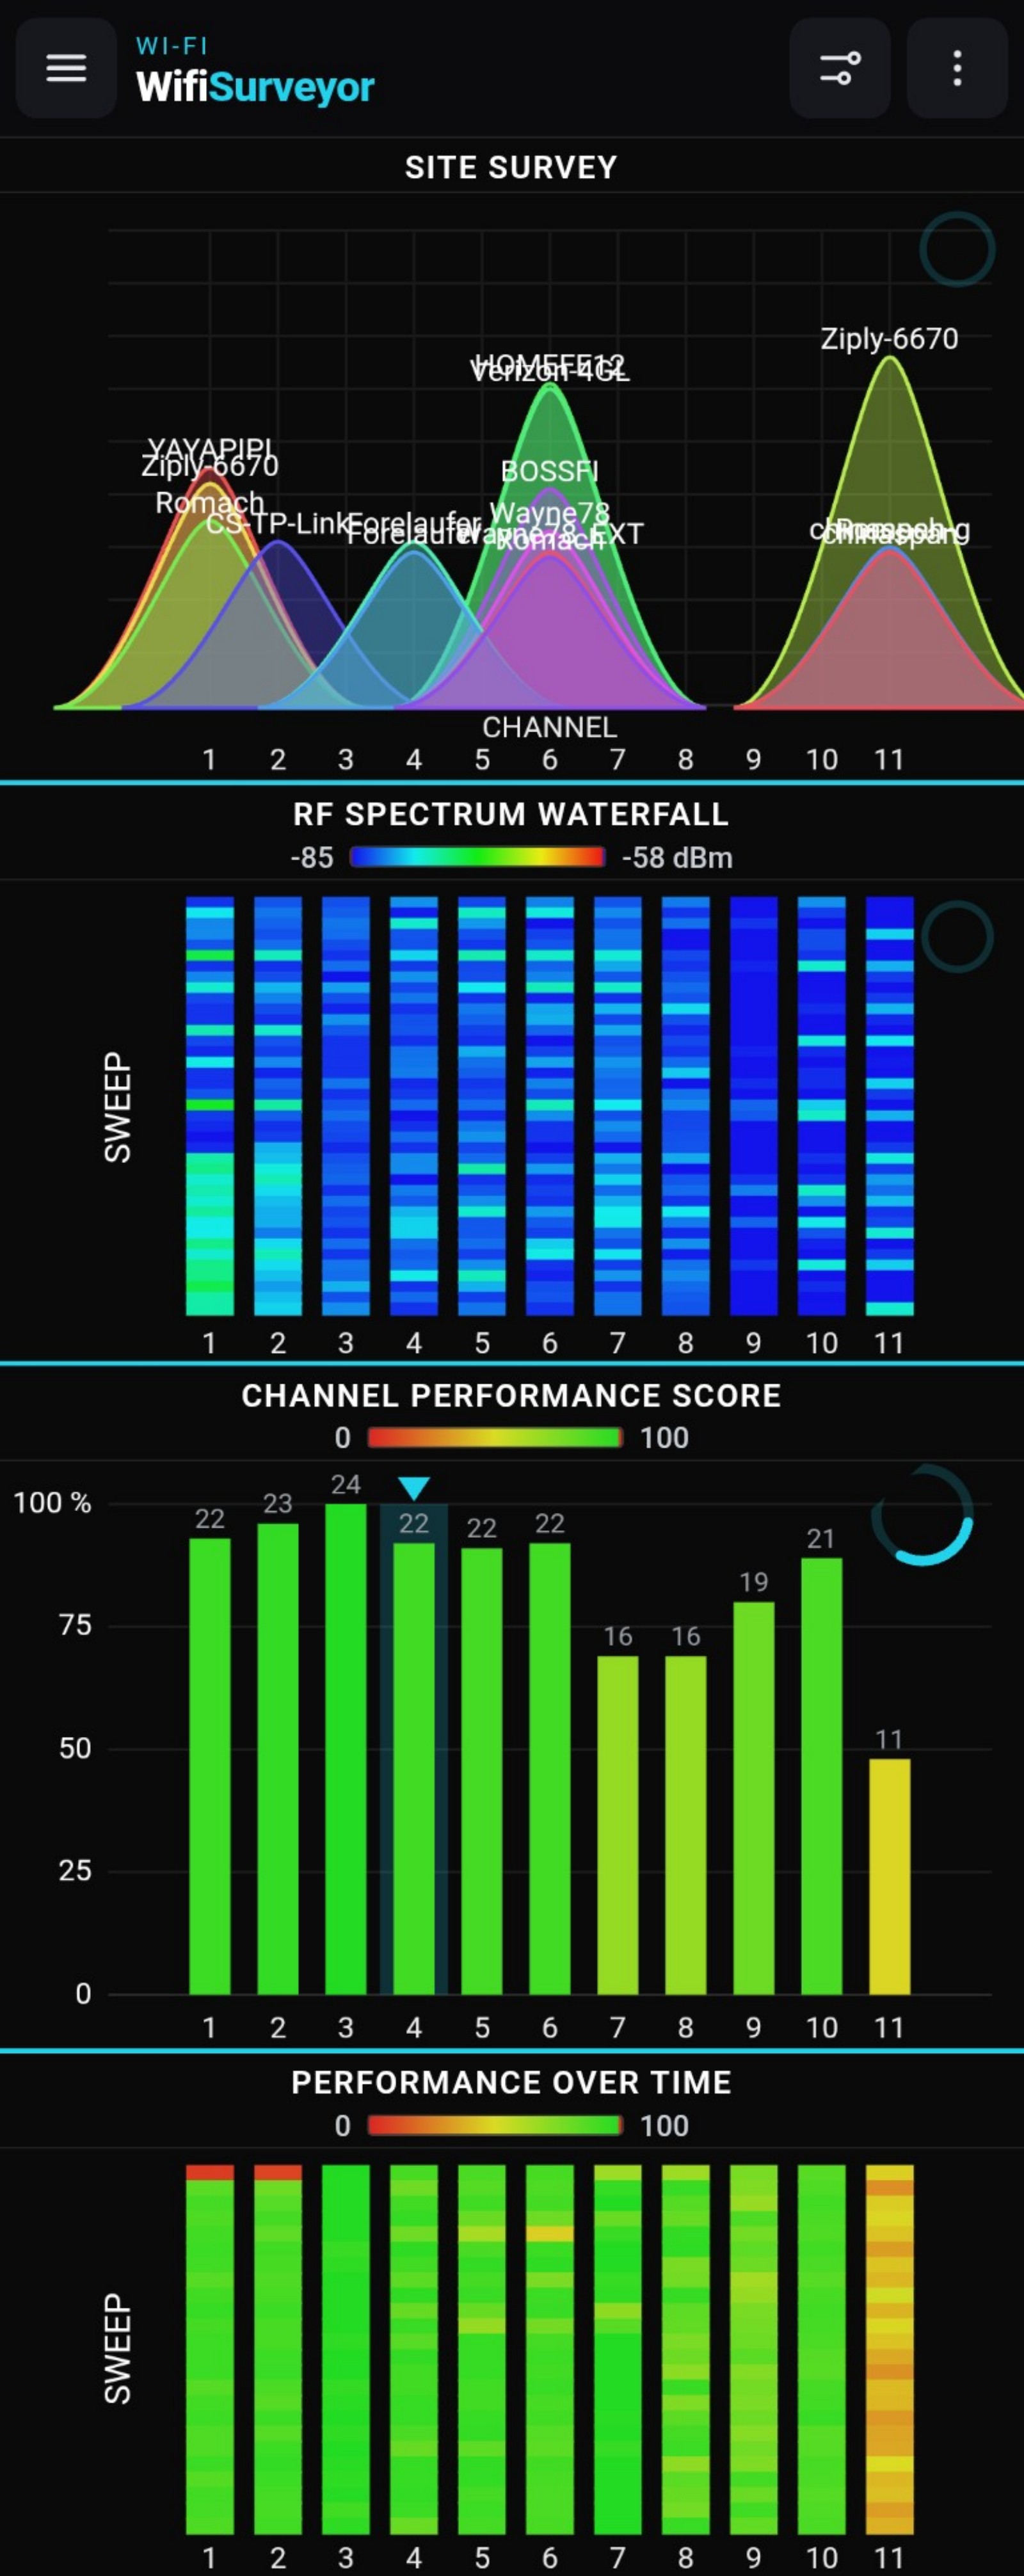
A channel can be crowded with identifiable Wi-Fi networks, affected by non-Wi-Fi energy that network discovery cannot name, or simply unable to deliver good performance. Those conditions may look similar to a user but call for different corrective actions.
map[WifiSurveyor synchronizes four stacked views:discovered access points, RF spectrum history, current channel-performance scores, and performance over time. Their shared channel axis makes relationships and contradictions visible.]
EXPLORE THE RELATED DESKTOP PRODUCT ↗Rather than asking one instrument to infer everything, WifiSurveyor lets three complementary measurement methods challenge and confirm one another.
Map discovered access points by channel and signal strength, with identity and security details available in the table.
Reveal energy from Wi-Fi and non-Wi-Fi sources as channel-aligned history.
Measure achieved transmit rate and track how each channel’s ranking changes over time.
Choose 2.4 or supported non-DFS 5 GHz channels covered by the attached RF Explorer radio.
Read the site-survey view and isolate access points relevant to the investigation.
Look for energy that agrees with the Wi-Fi scan—or reveals an unnamed interferer.
Let measured transmit rate determine which channel actually delivers the best result.
The stacked design makes it possible to follow a channel from nearby access points through RF activity to delivered performance.
WifiSurveyor separates what is discoverable, what is radiating, and what the channel can actually deliver.