01
Real-data performance grades
A through F grades translate measured throughput into useful expectations, from multiple 4K streams to barely usable. Letters keep printed and color-impaired reports readable.
WiFi Floor Plan maps real delivered throughput, then compares it with the link's capability to distinguish weak coverage from a crowded channel. It does far more than paint signal strength.
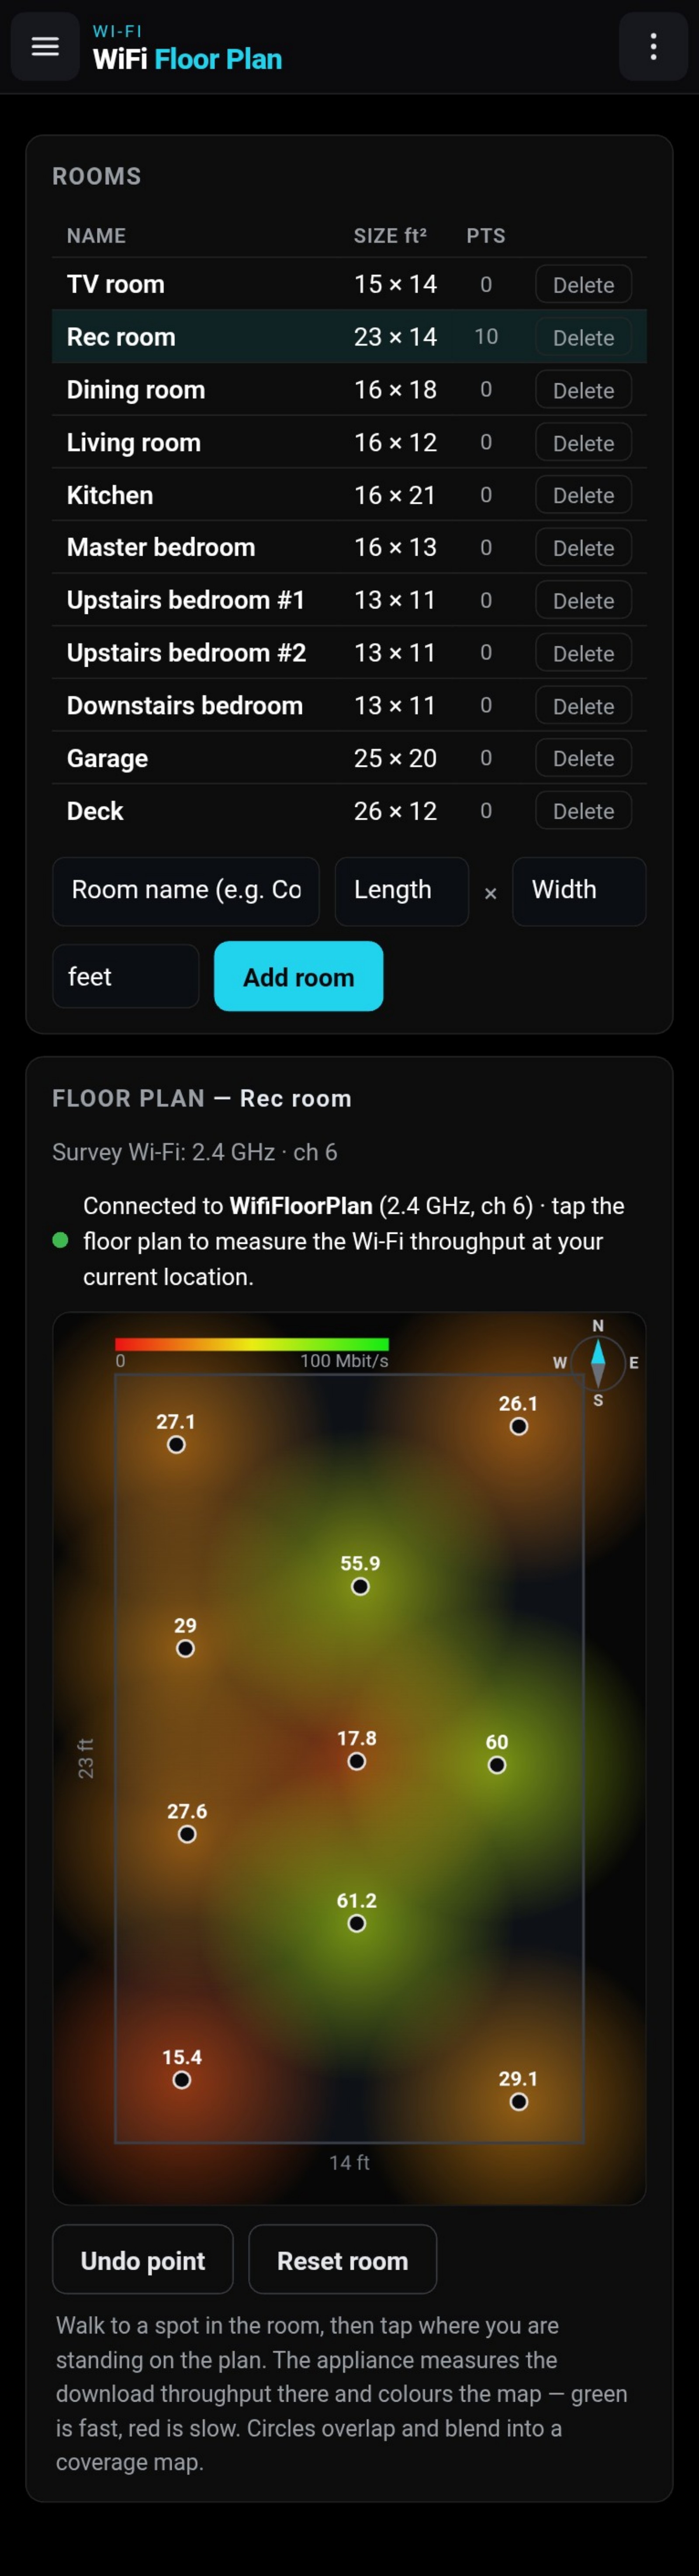
An RSSI map can show that a signal is weaker in one part of a room, but signal strength cannot tell you whether poor service comes from distance, a neighbor occupying the channel, or non-Wi-Fi interference. Moving an access point may fix the first problem and do nothing for the second.
map[At every location, WiFi Floor Plan measures what actually arrives and compares it with what the negotiated radio link should be capable of delivering. That comparison turns a colored coverage plot into a diagnostic map:move or add an access point when distance is responsible; change channel when airtime is being taken elsewhere.]
Each measured point carries two immediate visual signals—a letter and color for delivered performance, plus a blue arc for the share of link capability lost to activity on the channel.
A through F grades translate measured throughput into useful expectations, from multiple 4K streams to barely usable. Letters keep printed and color-impaired reports readable.
A blue arc grows around each point as less of the negotiated link capability is available. No arc suggests distance-limited performance; a closing circle reveals increasing channel pressure.
Inspect throughput, link rate, modulation, spatial streams, channel width, retransmissions, airtime, and appliance-measured uplink signal for each location.
Measurements use a 20 MHz survey channel, so grades express at-least-this-good service rather than promising peak client speed. Save the scaled map and its legend as a timestamped PDF.
Select the band and channel, press Set, and allow approximately 10 seconds for the appliance to broadcast the dedicated Floorplan network.
Connect the phone or laptop used for the survey to Floorplan and return to the browser. A no-internet warning on the appliance network is normal.
Name the space and enter its dimensions so the plan is drawn to scale.
Each tap transfers real data and records radio statistics at that physical location; overlapping points blend into the room-scale map.
Use the grade and blue arc together to decide whether to move or add an access point, change its channel, or leave a healthy location alone.
A weak grade without an arc points toward distance. The same grade with a strong arc points toward congestion. More samples sharpen the boundary between the two.
WiFi Floor Plan uniquely connects real throughput with link capability and airtime evidence, turning a walk-through survey into a map of what works, what does not, why, and what to change.